


对特朗普推文的情感分析: Python 🐍
- IYP

- Dec 4, 2018
- 10 min read
的确可以从一个人的推文中获得大量数据。本文仅基于昨天发布的文章话题做一个延伸演示,以特朗普为例提取推文数据以分析情感状态。尤其是希望介绍一些工具,期待你的创意挖掘

—— 描述 ——
在本文中我们将:
使用 tweepy 提取 twitter 数据,并学习如何使用 pandas 处理数据;
用 numpy,matplotlib 和 seaborn 做一些基本的统计和可视化;
使用 textblob 对提取的(特朗普)推文进行情绪分析。
事实上并不复杂。
我们需要什么?
首先,我们需要安装 Python。
几乎可以肯定所有代码都可以在 Python 2.7 中运行,但下文将使用的是 Python 3.6。强烈建议安装 Anaconda,它是一个非常有用的 Python 包管理平台,内置了很多有用的工具,例如 Jupyter Notebooks。我会用 Jupyter Notebook 讲解本文的代码,如果你在用其它的文本编辑器,也能跑一些简单的脚本,只是需要做些适配(不难)。
我们需要以下这些玩意:
NumPy:这是使用 Python 进行科学计算的基础包。除了明显的科学用途外,NumPy 还可以用作通用数据的高效多维容器。
Pandas: 这是一个开源库,提供高性能,易于使用的数据结构和数据分析工具。
Matplotlib:这是一个 Python 2D 绘图库,可以生成各种硬拷贝格式和跨平台交互式环境的出版物质量数据。
Seaborn:这是一个基于 matplotlib 的 Python 可视化库。它提供了一个高级界面,用于绘制有吸引力的统计图形。
Textblob:这是一个用于处理文本数据的 Python 库。它为潜入常见的自然语言处理(NLP)任务提供了一个简单的 API。
以上环境依赖都通过 pip 安装。待安装完所有软件包后,开始写代码。
现在开始!
1、提取 twitter 数据( tweepy + pandas )
1.1 导入库
这将是全部过程中最困难的部分......😥
开玩笑啦,显然不会!将如下代码复制到你的 Jupyter Notebook 上就行:
# General:
import tweepy           # To consume Twitter's API
import pandas as pd     # To handle data
import numpy as np      # For number computing

# For plotting and visualization:
from IPython.display import display
import matplotlib.pyplot as plt
import seaborn as sns
%matplotlib inline
很好!我们现在可以运行这个代码单元并转到下一小节。
1.2 创建一个 Twitter 应用
为了提取推文以进行后验分析,需要登录我们的推特开发者账号,并创建一个应用。进行这项操作的网站地址是:https://apps.twitter.com/ 没有账号的话,就注册一个。
从我们正在创建的这个应用程序中,将在名为 credentials.py的脚本中保存以下信息:
消费方密钥 Consumer Key (API Key)
消费方机密 Consumer Secret (API Secret)
访问令牌密钥 Access Token
访问令牌机密 Access Token Secret
此操作脚本示例如下:
# Twitter App access keys for @user

# Consume:
CONSUMER_KEY    = ''
CONSUMER_SECRET = ''

# Access:
ACCESS_TOKEN  = ''
ACCESS_SECRET = ''
创建这个额外文件的原因是只想导出这些变量的值,但在我们的主代码(Notebook)中看不见。我们现在可以使用 Twitter 的 API。为此,我们将创建一个允许我们进行密钥身份验证的函数。我们将在另一个代码单元中添加此函数,然后运行它:
# We import our access keys:
from credentials import *    # This will allow us to use the keys as variables

# API's setup:
def twitter_setup():
    """
    Utility function to setup the Twitter's API
    with our access keys provided.
    """
    # Authentication and access using keys:
    auth = tweepy.OAuthHandler(CONSUMER_KEY, CONSUMER_SECRET)
    auth.set_access_token(ACCESS_TOKEN, ACCESS_SECRET)

    # Return API with authentication:
    api = tweepy.API(auth)
    return api
到目前为止一切都是这么的容易。事实上的确就是这样。下面开始提取推文。
1.3 提取推文
现在,我们创建一个函数来设置推特 API,可以用该函数创建一个“extractor”对象。然后我们会使用 Tweepy 的函数 extractor.user_timeline(screen_name, count) 从 screen_name 的用户中提取 count 数量的推文。
正如标题中提到的,本文选择的用户是 @realDonaldTrump,是的,为了有趣。
提取 Twitter 数据的方法如下:
# We create an extractor object:
extractor = twitter_setup()

# We create a tweet list as follows:
tweets = extractor.user_timeline(screen_name="realDonaldTrump", count=200)
print("Number of tweets extracted: {}.\n".format(len(tweets)))

# We print the most recent 5 tweets:
print("5 recent tweets:\n")
for tweet in tweets[:5]:
    print(tweet.text)
    print()
有了这个,我们将得到类似于这样的输出,能够将输出与 Twitter 账户进行比较(以检查是否保持一致):
Number of tweets extracted: 200. 5 recent tweets: On behalf of @FLOTUS Melania & myself, THANK YOU for today's update & GREAT WORK! #SouthernBaptist @SendRelief,… https://t.co/4yZCeXCt6n I will be going to Texas and Louisiana tomorrow with First Lady. Great progress being made! Spending weekend working at White House. Stock Market up 5 months in a row! 'President Donald J. Trump Proclaims September 3, 2017, as a National Day of Prayer' #HurricaneHarvey #PrayForTexas… https://t.co/tOMfFWwEsN Texas is healing fast thanks to all of the great men & women who have been working so hard. But still so much to do. Will be back tomorrow!
我们现在有提取程序以及提取后的数据,它们在 tweets 变量中列出。必须提到该列表中的每个元素都是一个来自 Tweepy 的 tweet 对象,我们会在下部分学习怎样处理该数据。
1.4 创建(pandas)DataFrame
现在有了构建 pandas DataFrame 的初始信息,可以以非常简单的方式处理这些信息。
IPython 的 display 函数以浅显的方式绘制输出结果,数据帧的 head 模式允许我们可视化数据帧的前5个元素(或作为参数传递的第一个参数)。
所以,使用 Python 的列表理解:
# We create a pandas dataframe as follows:
data = pd.DataFrame(data=[tweet.text for tweet in tweets], columns=['Tweets'])

# We display the first 10 elements of the dataframe:
display(data.head(10))
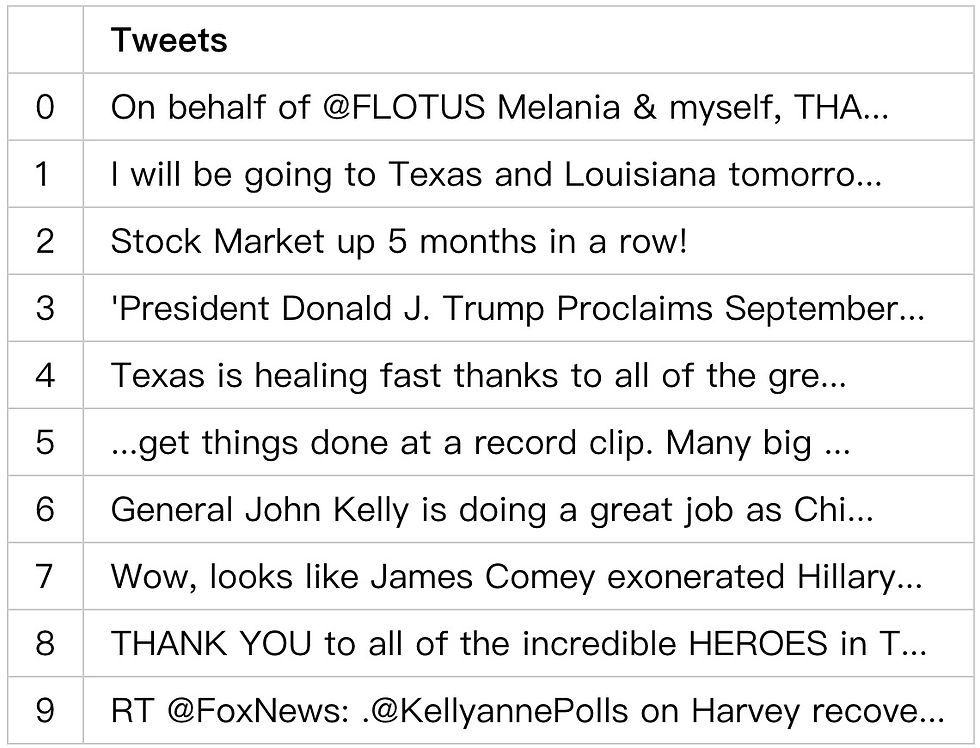
现在我们获得了一个数据排列有序的干净图表。
一个有趣的地方就是 Tweepy 中 tweets 结构具有的内部方法数量:
# Internal methods of a single tweet object:
print(dir(tweets[0]))
这将输出以下列表: ['__class__', '__delattr__', '__dict__', '__dir__', '__doc__', '__eq__', '__format__', '__ge__', '__getattribute__', '__getstate__', '__gt__', '__hash__', '__init__', '__init_subclass__', '__le__', '__lt__', '__module__', '__ne__', '__new__', '__reduce__', '__reduce_ex__', '__repr__', '__setattr__', '__sizeof__', '__str__', '__subclasshook__', '__weakref__', '_api', '_json', 'author', 'contributors', 'coordinates', 'created_at', 'destroy', 'entities', 'favorite', 'favorite_count', 'favorited', 'geo', 'id', 'id_str', 'in_reply_to_screen_name', 'in_reply_to_status_id', 'in_reply_to_status_id_str', 'in_reply_to_user_id', 'in_reply_to_user_id_str', 'is_quote_status', 'lang', 'parse', 'parse_list', 'place', 'possibly_sensitive', 'retweet', 'retweet_count', 'retweeted', 'retweets', 'source', 'source_url', 'text', 'truncated', 'user']
这里有趣的部分是单个推文中包含的元数据数量。如果我们想要获取创建日期或创建源等数据,就可以使用此属性访问信息。一个例子如下:
# We print info from the first tweet:
print(tweets[0].id)
print(tweets[0].created_at)
print(tweets[0].source)
print(tweets[0].favorite_count)
print(tweets[0].retweet_count)
print(tweets[0].geo)
print(tweets[0].coordinates)
print(tweets[0].entities)
然后获得这样的输出: 903778130850131970 2017-09-02 00:34:32 Twitter for iPhone 24572 5585 None None {'hashtags': [{'text': 'SouthernBaptist', 'indices': [90, 106]}], 'symbols': [], 'user_mentions': [{'screen_name': 'FLOTUS', 'name': 'Melania Trump', 'id': 818876014390603776, 'id_str': '818876014390603776', 'indices': [13, 20]}, {'screen_name': 'sendrelief', 'name': 'Send Relief', 'id': 3228928584, 'id_str': '3228928584', 'indices': [107, 118]}], 'urls': [{'url': 'https://t.co/4yZCeXCt6n', 'expanded_url': 'https://twitter.com/i/web/status/903778130850131970', 'display_url': 'twitter.com/i/web/status/9…', 'indices': [121, 144]}]}
我们现在能够调用相关数据并将其添加到我们的数据帧中。
1.5 将相关信息添加到数据帧
我们可以看到,通过一条推文就能获得大量的数据。但并非所有这些数据对特定的目标来说总是有用的。在本文的例子中,我们只需要向数据帧中添加一些数据。为此,我们将使用 Pythons 列表理解,只需在方括号之间添加内容名称并分配内容,就可以将新列添加到数据帧中。代码如这样:
# We add relevant data:
data['len']  = np.array([len(tweet.text) for tweet in tweets])
data['ID']   = np.array([tweet.id for tweet in tweets])
data['Date'] = np.array([tweet.created_at for tweet in tweets])
data['Source'] = np.array([tweet.source for tweet in tweets])
data['Likes']  = np.array([tweet.favorite_count for tweet in tweets])
data['RTs']    = np.array([tweet.retweet_count for tweet in tweets])
再次显示 dataframe 以查看我们刚才的更改...:
# Display of first 10 elements from dataframe:
display(data.head(10))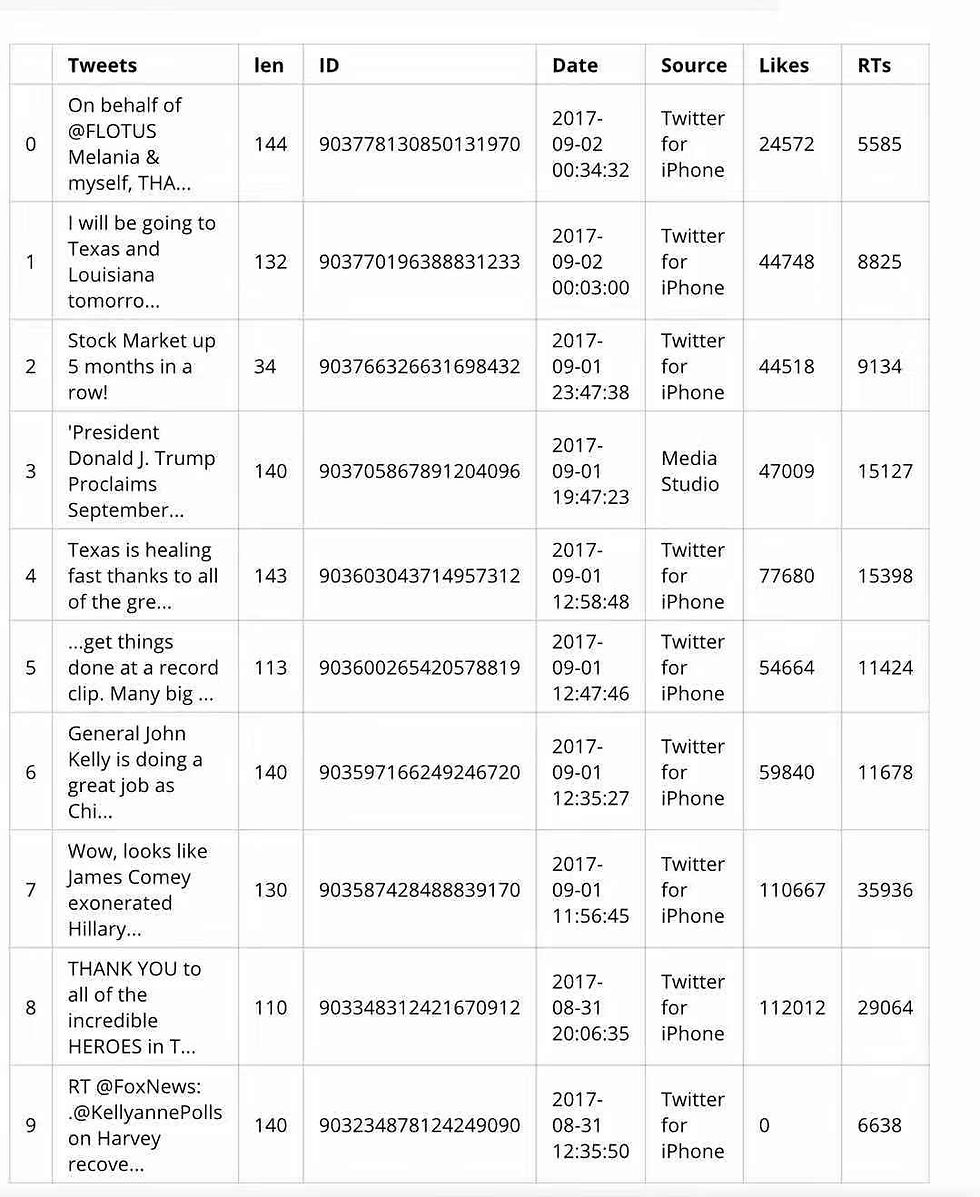
现在我们已经以易于处理的有序方式提取和获取了数据,已经准备好进行一些操作以可视化一些图并收集一些统计数据。这篇文章的第一部分已经完成。
2.可视化和基本统计
2.1 平均值和受欢迎程度
我们首先想要计算一些基本的统计数据,例如所有推文的字符长度的平均值,带有更多点赞和转推等等。
只需要添加以下代码。为了获得平均值,使用 numpy:
# We extract the mean of lenghts:
mean = np.mean(data['len'])

print("The lenght's average in tweets: {}".format(mean))
The lenght's average in tweets: 125.925
为了提取更多数据,还要使用一些 pandas 的功能:
# We extract the tweet with more FAVs and more RTs:

fav_max = np.max(data['Likes'])
rt_max  = np.max(data['RTs'])

fav = data[data.Likes == fav_max].index[0]
rt  = data[data.RTs == rt_max].index[0]

# Max FAVs:
print("The tweet with more likes is: \n{}".format(data['Tweets'][fav]))
print("Number of likes: {}".format(fav_max))
print("{} characters.\n".format(data['len'][fav]))

# Max RTs:
print("The tweet with more retweets is: \n{}".format(data['Tweets'][rt]))
print("Number of retweets: {}".format(rt_max))
print("{} characters.\n".format(data['len'][rt]))
The tweet with more likes is: The United States condemns the terror attack in Barcelona, Spain, and will do whatever is necessary to help. Be tough & strong, we love you! Number of likes: 222205 144 characters.
The tweet with more retweets is: The United States condemns the terror attack in Barcelona, Spain, and will do whatever is necessary to help. Be tough & strong, we love you! Number of retweets: 66099 144 characters.
点赞多的推文也是转发多的推文,这似乎很常见,但并不一定是个规律。现在正在做的是使用 Numpy 的 max 函数找出‘likes’列里面的最大点赞数和‘RTs’中的最大转发数,只需寻找两列中每一列里满足最大值条件的索引。由于转发数与点赞数(最大值)相同的推文可能不止一条,我们只需取用找到的第一个结果,所以我们使用 .index[0] 将索引分配给变量 fa 和 rt。要想输出满足条件的推文,我们访问数据的方式和访问矩阵或任何索引对象的方式是一样的。
现在已经准备好绘制一些东西了。
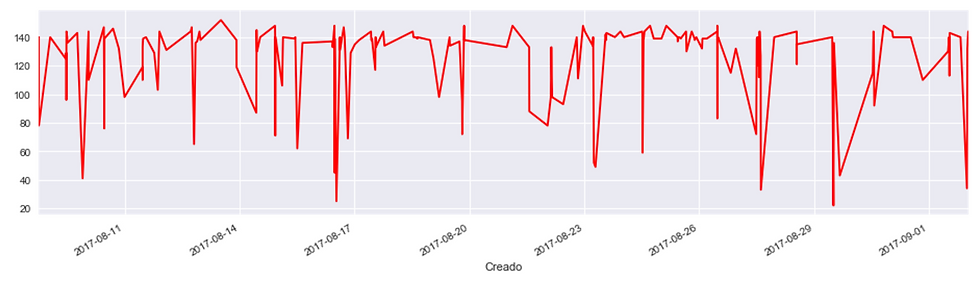
2.2. Time series
Pandas 有自己的时间序列对象。由于我们有一个带有创建日期的整个向量,所以分别按照推文长度、点赞数和转发数来构造数据的时序。
方式是这样的:
# We create time series for data:

tlen = pd.Series(data=data['len'].values, index=data['Date'])
tfav = pd.Series(data=data['Likes'].values, index=data['Date'])
tret = pd.Series(data=data['RTs'].values, index=data['Date'])
如果想绘制时间序列,可以使用 Pandas 在对象中的方法。绘制方法如下:
# Lenghts along time:
tlen.plot(figsize=(16,4), color='r');
这将创建以下输出:
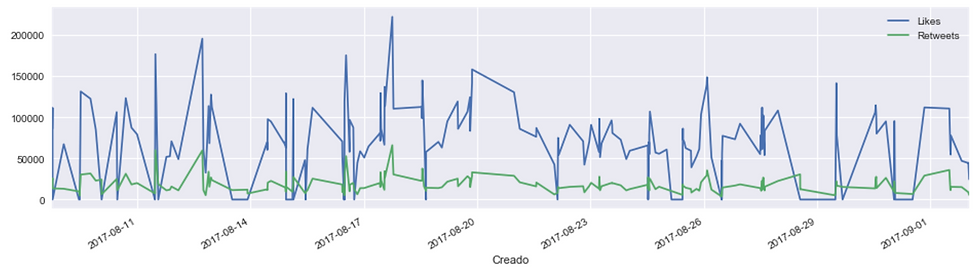
并在同一图表中绘制出点赞数和转发数对比的方式为:
# Likes vs retweets visualization:
tfav.plot(figsize=(16,4), label="Likes", legend=True)
tret.plot(figsize=(16,4), label="Retweets", legend=True);
这将创建以下输出:
2.3 饼图绘制来源
第二部分已经差不多完成了。现在要在饼图中绘制,因为我们意识到并非每条推文都是同一个来源的 (😱🤔)。我们首先清理所有来源:
# We obtain all possible sources:
sources = []
for source in data['Source']:
    if source not in sources:
        sources.append(source)

# We print sources list:
print("Creation of content sources:")
for source in sources:
    print("* {}".format(source))
通过以下输出,我们意识到基本上特朗普这个 Twitter 帐户有两个来源: Creation of content sources: * Twitter for iPhone * Media Studio
我们现在计算每个来源的数量并创建一个饼图。你会注意到这个代码单元不是最优化的...凑合一下吧。
# We create a numpy vector mapped to labels:
percent = np.zeros(len(sources))

for source in data['Source']:
    for index in range(len(sources)):
        if source == sources[index]:
            percent[index] += 1
            pass

percent /= 100

# Pie chart:
pie_chart = pd.Series(percent, index=sources, name='Sources')
pie_chart.plot.pie(fontsize=11, autopct='%.2f', figsize=(6, 6));
然后我们得到像这样的输出:

我们可以看到每个来源的推文百分比。现在可以继续进行情感分析了。
3. 情感分析
3.1 导入 textblob
正如本文开头所提到的,textblob 将允许我们以非常简单的方式进行情绪分析。我们还将使用 Python 中的 re 库,它用于处理正则表达式。为此,我将为您提供两个实用程序函数:a)清理文本(这意味着任何与字母数字值不同的符号将重新映射到满足此条件的新符号),b)创建分析器在清洗文本后分析每条推文的归一性。
代码如下:
from textblob import TextBlob
import re

def clean_tweet(tweet):
    '''
    Utility function to clean the text in a tweet by removing
    links and special characters using regex.
    '''
    return ' '.join(re.sub("(@[A-Za-z0-9]+)|([^0-9A-Za-z \t])|(\w+:\/\/\S+)", " ", tweet).split())

def analize_sentiment(tweet):
    '''
    Utility function to classify the polarity of a tweet
    using textblob.
    '''
    analysis = TextBlob(clean_tweet(tweet))
    if analysis.sentiment.polarity > 0:
        return 1
    elif analysis.sentiment.polarity == 0:
        return 0
    else:
        return -1
因为 Textblob 提供训练好的分析器,所以事情就好办多了。Textblob 能使用多种不同的自然语言处理模型。如果你想训练你自己的分类器(或者想知道它的工作方式),点击这个链接。
效果应该差不多,因为我们用的是预训练模型。
总之回到代码部分,向数据中再添加一列。这个列会包含语义分析,我们可以绘制出 dataframe 查看更新结果:
# We create a column with the result of the analysis:
data['SA'] = np.array([ analize_sentiment(tweet) for tweet in data['Tweets'] ])

# We display the updated dataframe with the new column:
display(data.head(10))
获取新的输出:
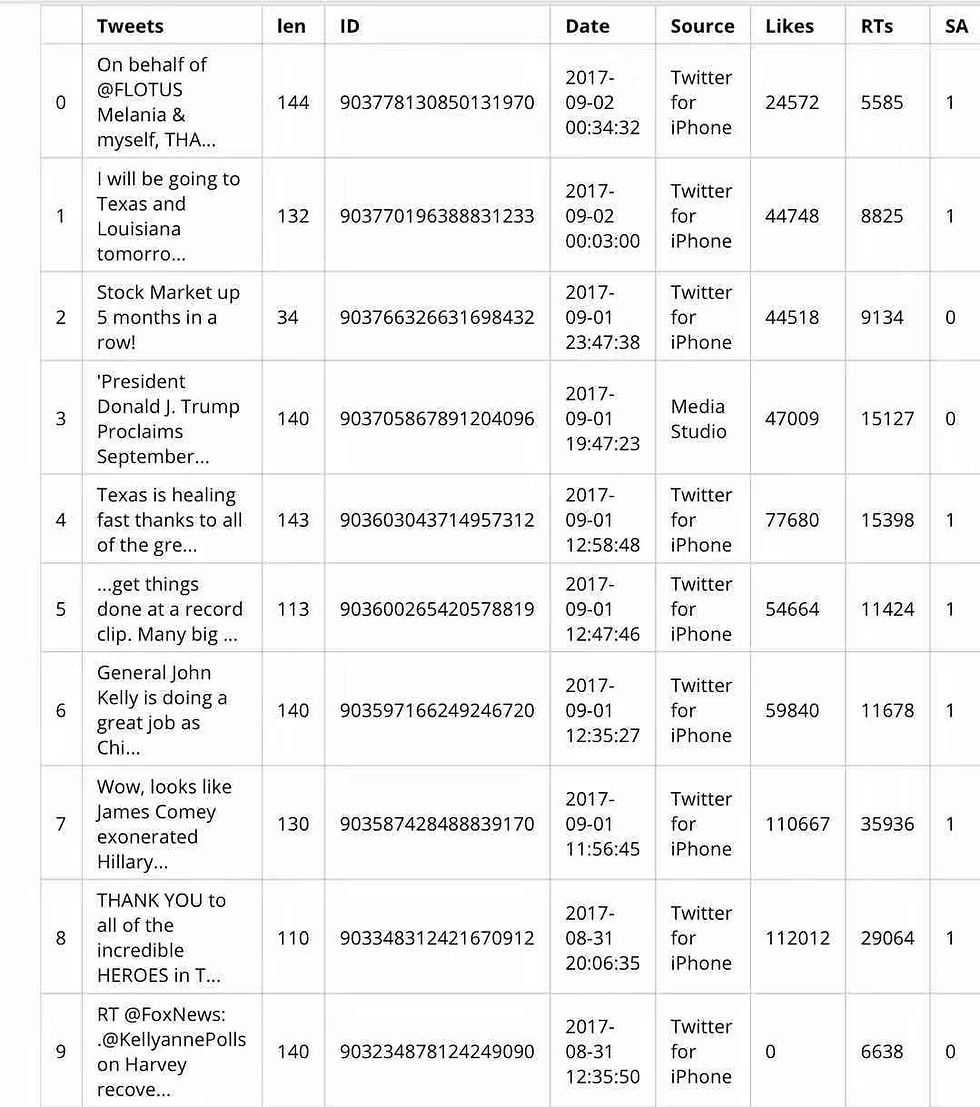
可以看到,最后一列包含了语义分析结果(SA)。现在只需检查结果。
分析结果
我们以简单的方式检查语义分析结果,分别计算出包含正面情绪、负面情绪和中性情绪的推文,及其比例。
pos_tweets = [ tweet for index, tweet in enumerate(data['Tweets']) if data['SA'][index] > 0]
neu_tweets = [ tweet for index, tweet in enumerate(data['Tweets']) if data['SA'][index] == 0]
neg_tweets = [ tweet for index, tweet in enumerate(data['Tweets']) if data['SA'][index] < 0]
现在我们获得了列表,只需打印出比例:
print("Percentage of positive tweets: {}%".format(len(pos_tweets)*100/len(data['Tweets'])))
print("Percentage of neutral tweets: {}%".format(len(neu_tweets)*100/len(data['Tweets'])))
print("Percentage de negative tweets: {}%".format(len(neg_tweets)*100/len(data['Tweets'])))
获得如下结果:
Percentage of positive tweets: 51.0% Percentage of neutral tweets: 27.0% Percentage de negative tweets: 22.0%
不过考虑到我们只收集了特朗普推特账户的 200 条推文,如果想获得更高的准确度,可以收集更多推文。
从本文我们可以看到,使用 Python 能够完成提取数据、处理数据、可视化数据和分析数据这一套流程。希望本文能对大家使用 Python 进行文本处理有所帮助。
工具:
正如您所看到的,可以使用 Python 以非常简单的方式提取、操作、可视化和分析数据。希望读者能使用这些工具实现创新性的探索。◾️
欢迎关注我们的新博客:https://iyouport.weebly.com/ 正在逐步迁移并改版!


Comments